.svg)


.png)


The competition for seller leads is heating up in 2021! Our VP, Client Marketing, Dan Lott recently released a report breaking down which real estate markets across the country are seeing the fiercest battles for seller leads online. In addition, Dan also highlights which markets have been more immune from the competition. Particularly interesting, the disparity between real estate buyer lead costs and seller lead costs has been the greatest in cities projected to have the hottest markets at the beginning of the year.
20% Improvement in CPL for Buyer Leads in Q1 2021
The strong 1st quarter results continued the fast pace from 2020 which was driven in part by the pandemic which increased home search traffic throughout the year.
Though the overall cost per lead improved 19 percent, a few markets had higher lead prices in 2021 than 2020. The peak climber was El Paso which jumped 461% to a still good $4.37.
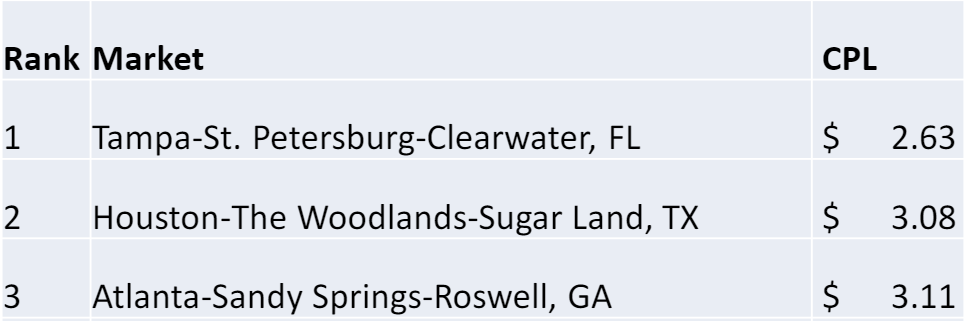
Even so, 87 of the top 100 largest markets improved year over year. Waco, TX, Columbus, GA, and Beaumont, TX, had the best CPL overall. The best performing large markets were Tampa, Houston, and Atlanta.
The CPL should remain at the low levels during the 2nd quarter. However, because the results will be compared to a very robust 2020 2nd quarter, we may see a bit of a year-over-year increase
Seller CPL Competition is Driving Up Bids Across the Board On Google in Early 2021
Seller leads are hot. So far in 2021 CINC has experienced unprecedented interest from clients looking to add seller leads to their advertising mix. This unusually strong interest in seller leads has driven up the CPL for seller leads slightly during the first quarter.
Unlike in buyer leads which are at a record low lead price level of only $3.90, the portfolio Seller CPL increased from $9.56 to $12.18 year over year. Even at these slightly higher levels, seller leads are the best advertising choice to get new listings in a time when home inventory is low.
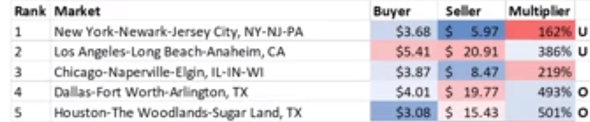
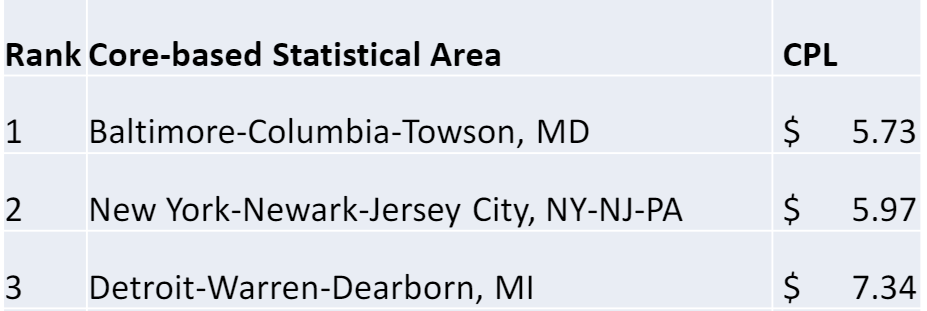
Some markets like Baltimore, New York, and Detroit have seller lead prices that are almost as low as the buyer lead prices. While others like Los Angeles and Dallas have seller lead prices that are much higher than the buyer lead price.
With available inventory on the market forecasted to remain low, we expect seller leads to remain in high demand in the 2nd quarter. This should cause the lead prices to remain at their slightly elevated levels throughout the spring.
After analyzing third-party data on the hottest projected real estate markets, we found that there was a strong correlation between buyer & seller leads costs and how hot the market was projected to be.
For instance, in Tampa (one of the projected hottest markets at beginning of 2021), we saw an 1135% difference between seller CPL's ($29.85/lead) and buyer CPL's ($2.63/lead).
In contrast, in New York City (one of the projected weaker markets at beginning of 2021), we saw a 162% difference between seller CPL's ($3.68) and buyer CPL's (162%).